Databricks AI/BI: How to Deliver Conversational, Self-Service Analytics at Scale
By John Bemenderfer
You have invested heavily in your data lakehouse, yet your business users still face frustrating delays when they need actionable insights. Traditional BI tools add complexity, forcing reliance on analysts or cumbersome manual queries. Databricks AI/BI is a tool that can solve this directly — delivering conversational analytics right in your Databricks environment. In this blog, we’ll explore how Databricks AI/BI accelerates your path to clear, confident decisions — eliminating traditional analytics roadblocks.
Traditional BI often isolates users from their data, slowing down critical decisions. Databricks AI/BI is a tool that combines conversational analytics with Compound AI to deliver instant, user-friendly insights directly within your lakehouse.
About Compound AI: The Framework that Powers Databricks AI/BI
Databricks AI/BI uses Compound AI — a framework where multiple specialized AI agents work together to understand your questions, analyze your data, and deliver clear, relevant answers in real time. This goes beyond simple natural language tools that just convert text into SQL.
These AI agents collaborate to:
Understand your business terms and context
Optimize queries based on your data patterns
Choose the best way to visualize results
Explain insights in clear, business-friendly language
This architecture makes it possible for business users to ask open-ended questions — like “Why did conversions spike last Tuesday?” — and get meaningful, immediate answers without relying on analysts or writing code.
Compound AI is what makes Databricks AI/BI truly self-service. It removes the technical barriers between your users and their data so they can follow their curiosity and make confident decisions, fast.
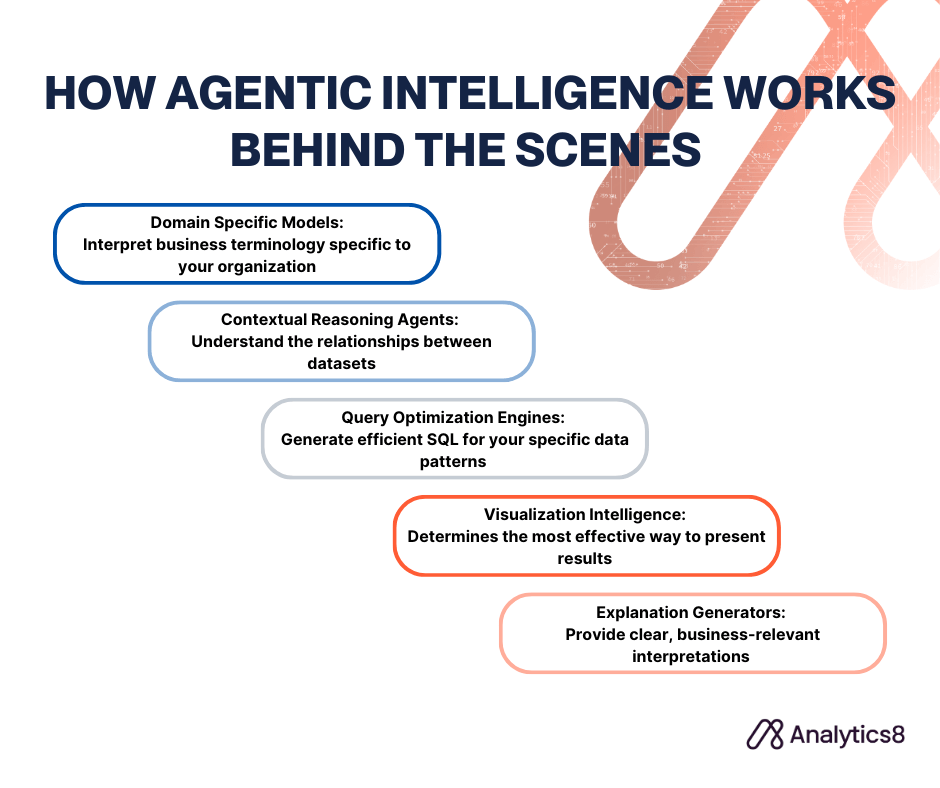
How Agentic Intelligence Works Behind the Scenes
How Databricks AI/BI uses specialized agents to interpret, reason, and explain your data.
What makes Databricks AI/BI more than just a natural language interface is how its Compound AI system enables agentic intelligence. Multiple specialized agents collaborate in real time — not just to generate SQL, but to reason through complex questions, adapt to your data’s structure, and deliver clear, contextual answers.
Here’s how those agents work together:
Domain-specific models interpret business terminology specific to your organization
Contextual reasoning agents understand the relationships between datasets
Query optimization engines generate efficient SQL for your specific data patterns
Visualization intelligence determines the most effective way to present results
Explanation generators provide clear, business-relevant interpretations
This multi-agent architecture enables capabilities that single-model approaches cannot match:
Native data understanding: Works directly with your Databricks tables, views, and models — no translation layers
Contextual intelligence: Learns from query history, Unity Catalog metadata, and data lineage
Progressive learning: Improves over time by adapting to your organization’s unique language and questions
Cross-domain analytics: Seamlessly blends structured data, machine learning insights, and business metrics
By blending machine intelligence with business context, Databricks AI/BI helps your users move faster and make better decisions — without losing trust, governance, or control.
About AI/BI Dashboards and How They’re Different
AI/BI dashboards improve upon traditional dashboards by making them adaptive, intelligent, and fully integrated with your Databricks environment. Instead of static reports and rigid filters — your users get dynamic interfaces that respond to how they naturally think and work.
Here’s how AI/BI dashboards make your analytics workflow more intuitive and efficient:
Ask in plain English: Request the chart or insight you need — no SQL required
Build without code: Drag and drop to create multi-page reports with AI guidance
Define custom metrics: Create calculated fields like profit margin on the fly
Query live data: Work directly from your Databricks SQL warehouse — no extracts
Share with ease: Distribute dashboards to anyone with a Databricks account
Work at scale: Handle large datasets with responsive performance using Photon
These features enable your teams to go from questions to answers without delay. Whether it’s a marketing lead analyzing campaign performance or a finance manager investigating spend, users can explore data in real time — no analyst gatekeeping required.
And because everything is tied to governed data models and Unity Catalog, your dashboards maintain a single source of truth. That means faster insights, fewer data discrepancies, and decisions you can trust.
About Genie, The Always-On Analytics Assistant
Databricks Genie is your always-on analytics assistant — a conversational interface that lets you explore data naturally, without relying on prebuilt dashboards or predefined paths. When a question strikes, Genie is ready. It understands your company’s terminology, knows the structure of your Databricks environment, and builds visualizations that actually make sense. It even remembers the context of your previous questions, so you can dig deeper without starting over.
Here’s what sets Genie apart:
Ask anything, in plain language: Type questions like “What customer segments responded best to our latest campaign?” and get back clear charts or explanations — instantly.
Go deeper with follow-ups: Genie keeps context, so you can refine your questions on the fly (“Now break that down by region”).
Think like an analyst: Genie uses Chain-of-Thought reasoning to break complex queries into steps — identifying relevant columns, planning SQL, and delivering answers that make sense.
Visuals when you need them: Genie chooses the right visual automatically, and you can adjust it just like in an AI/BI Dashboard.
Improves with every interaction: Genie gets smarter as it learns how your organization works — its terms, data relationships, and most-asked questions.
Built on Compound AI: Multiple agents work behind the scenes to connect your questions to your data, metadata, and query history — no manual setup required.
Here’s what this looks like in practice: During board prep, your CFO spots a spike in Q1 expenses. Instead of kicking off a follow-up with Finance, they ask Genie: “Why are Q1 expenses higher than forecast?” Genie immediately pulls the data, identifies increased travel in Sales, and surfaces a clear explanation — plus a chart. With follow-ups like “How does this compare to last year?” or “Break it down by region,” they get answers in real time.
Or take your marketing team: when a campaign exceeds expectations, they can go beyond the surface and ask Genie what drove engagement, which segments responded best, and how it compares to past launches — all without waiting on custom reports.
And because Genie works with your governed Databricks data, every answer is traceable. You get flexibility, speed, and trust — all in one.
Tips to Launch and Scale AI/BI Effectively
To get the most from Databricks AI/BI, start with a focused approach that builds momentum across your teams.
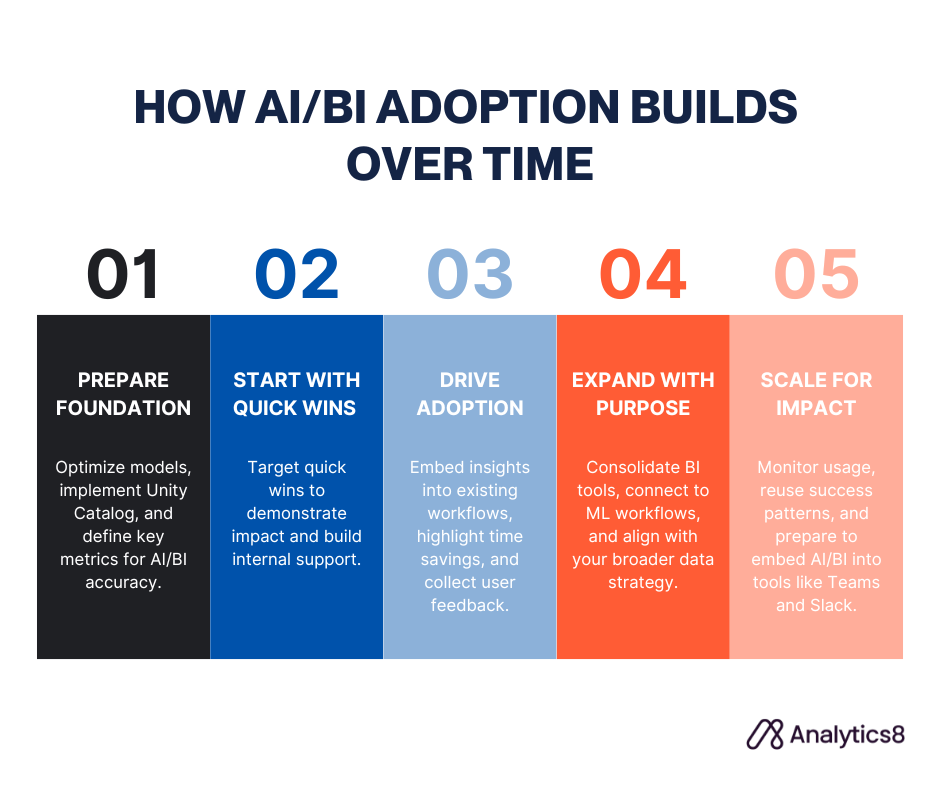
Follow these five steps to launch and scale Databricks AI/BI with speed and impact.
Prepare your foundation You’re already ahead with Databricks in place. Now make it AI/BI-ready:
Optimize your data models: Clean structure improves accuracy and usability.
Implement Unity Catalog: Apply consistent governance and track lineage.
Define key metrics: Standardize business terms to boost AI understanding.
Start with quick wins Target visible use cases that prove value fast:
Focus on impact areas: Sales, marketing, ops — where faster insights matter most.
Engage early champions: Partner with teams eager to test and provide feedback.
Reuse what works: Turn existing SQL queries into interactive dashboards.
Make adoption easy Show users why this is better — not just new:
Plug into workflows: Keep insights inside Databricks, no tool-hopping required.
Show the time savings: Compare minutes with Genie vs. days waiting on reports.
Capture feedback: Use it to guide rollout and improvements.
Expand with purpose Scale intentionally as adoption grows:
Consolidate BI tools: Cut overlap and redirect users to AI/BI dashboards.
Bridge to ML: Connect AI/BI with predictive models already in use.
Align with strategy: Ensure it supports your broader data goals.
Scale for lasting impact Set yourself up for sustainable growth:
Track adoption: Monitor usage, speed, and user experience.
Expand by example: Apply lessons learned to new teams or departments.
Prepare for APIs: Get ready to embed Genie into apps like Teams or Slack.
The result? Faster decisions, better access, and more value from your Databricks investment — without adding complexity.
What’s Coming Next for Databricks AI/BI
Databricks AI/BI isn’t standing still. Several new capabilities are on the horizon — each designed to make your analytics even more intelligent, integrated, and accessible.
Here’s what’s coming:
Wider availability across platforms: AI/BI Dashboards are now generally available on AWS and Azure, with Google Cloud in public preview. Genie is also expanding to GCP, and Databricks is exploring ways to bring Genie’s capabilities to other BI tools via APIs.
Calculated dimensions: Soon, you’ll be able to define non-aggregated fields like “Age Range” directly in dashboards — no custom SQL needed. This builds on the flexibility of calculated measures and simplifies how you group and compare data.
Workflow integration: AI/BI Dashboards will soon support Databricks Workflows, enabling end-to-end orchestration — from data ingestion to dashboard refresh — with unified monitoring and dependency management.
Conversational APIs: Genie is getting an API. This means your developers will be able to embed Genie’s conversational intelligence into apps like Microsoft Teams, Slack, or custom-built portals.
Smarter query context with Value Indexing: Genie will soon sample string column values to better understand what each column represents — so when someone types “California,” it knows to query “CA.”
Continuous learning, faster iteration: Powered by Compound AI and accelerated by MosaicML, Databricks AI/BI will continue getting smarter as it learns from real usage and feedback.
The shift to AI-first BI: Databricks AI/BI reflects a broader movement — BI is becoming conversational, dynamic, and AI-driven. Organizations embracing this shift now will be positioned to move faster, stay aligned, and get more value from their data every day.
Talk With a Data Analytics Expert
Key Takeaways
Databricks AI/BI brings conversational analytics to your lakehouse, allowing users to ask questions in plain English and get instant insights, no SQL or analysts required.
Compound AI powers the system, using multiple agents for query optimization, data interpretation, and clear, business-aware answers.
Agentic intelligence enables learning over time, adapting to metadata, lineage, and usage to improve relevance and context.
AI/BI dashboards are dynamic and code-free, supporting real-time queries, custom metrics, and intuitive report building.
Genie is your always-on analytics assistant, enabling natural follow-ups, auto-generated visuals, and context-aware exploration with governed data.
Start with a strong foundation by optimizing models, defining key metrics, and focusing on quick wins to drive adoption.
Scale strategically by aligning with ML workflows, consolidating tools, and preparing for integrations into everyday business apps.
Upcoming features like conversational APIs and calculated dimensions will extend AI/BI’s reach and support the shift to AI-first business intelligence.
John is a Managing Consultant based in our Dallas office. He brings broad expertise across the entire data stack—from data engineering and analytics to generative AI—helping clients unlock real value from their data. Outside of work, John enjoys spending time with his wife, daughter, and son, diving into Dungeons & Dragons campaigns, and all things Star Wars.
When creating data visualizations and dashboards, it’s not just about creating “pretty charts.” It’s about effectively communicating the meaning of data to your users. Here are 6 tips to create powerful data visualizations in your BI and analytics platforms. Data-driven decision making is integral for any organization. However, just because you have the data, doesn’t…
In this blog, we will show you how to bring data from Project Online into your existing reporting environment, such as Qlik or Tableau. We’ll also show you how to work through a pesky bug that may accompany your implementation. Project management is important to any release. There are several quality tools out there to…
In this blog, we provide insight as to why manual data practices can bring unnecessary risk to your projects and how to overcome those obstacles. Why Manual Processes Aren’t “Good Enough” While every analyst knows that automation practices lead to better data quality, more accurate reporting, and ultimately the ability for them to focus on…
We had the opportunity to interview the Director of Analytics Services at EDUCAUSE to learn more about how they’re getting their higher education association members to be more successful with their data. Here’s what she had to say. Data and Analytics in Higher Education About EDUCAUSE and Leah EDUCAUSE is a higher education technology association…
Companies utilizing BI tools often rely on constant data refreshes, which is adequate for some daily reports and dashboards. But as streaming data becomes more popular and 24×7 customer expectations increase, refreshing is not enough. To meet evolving business demands, Power BI offers two options for real-time reports and dashboards. Analytics systems working in near-…
In this blog, we discuss the elements of a style guide that will increase user adoption and take full advantage of the powerful design tools within Power BI. User adoption is crucial to the success of any business intelligence (BI) implementation. A BI developer can create rich reporting that uncovers valuable insights, but if the…
Data Strategy Session
To thrive with your data, your people, processes, and technology must all be data-focused. This may sound daunting, but we can help you get there. Sign up to meet with one of our analytics experts who will review your data struggles and help map out steps to achieve data-driven decision making.
Fill out this form to get a 30-minute Data Strategy Session with one of our analytics experts.
Contact Us
Have questions? Tell us a little about yourself, and we'll get in touch as soon as we can.